Unlocking Growth with Your App User Retention Rate

Getting users in the door is the easy part. The real work—and the secret to a sustainable project—is getting them to stay. That's what app user retention rate is all about.
It’s simply the percentage of people who come back to your app after their first visit. A high number means you’ve built something people genuinely value. A low one is a flashing red light that your app isn't sticky enough.
Why Your App User Retention Rate Is the Bedrock of Growth
Think of it this way: are you throwing a massive one-night-only party or building an exclusive club people can't wait to return to? The party is a constant, expensive scramble for new guests. The club, on the other hand, builds a loyal community and real, lasting value.
This is exactly why your app user retention rate isn't just another number on a dashboard; it’s the ultimate health check for your product and ecosystem. It's the engine that powers real growth.
The Real Impact of Strong Retention
For starters, keeping users around directly slashes your effective Customer Acquisition Cost (CAC). When people stick with you, their lifetime value (LTV) shoots up, which means you can justify spending more to bring in new users. Even better, happy, long-term users become your most powerful marketing channel, spreading the word and driving organic growth for free.
Solid retention also creates an incredible feedback loop. It’s your most engaged users who give you the best insights, telling you what they love and what needs fixing. This kicks off a powerful cycle:
- Retained users give you priceless feedback.
- You use that feedback to make the product better.
- A better product makes even more users stick around.
The Brutal Reality of User Drop-Off
Now for the tough part. Most apps hemorrhage users right out of the gate. The data shows a pretty grim picture for the average mobile app—only about 25% of users even bother to open it a second time on Day 1.
By the end of the first week, that number often drops to just 10-12%. And after a month? You're lucky if you're holding on to 5-8% of your initial user base. It's a steep, unforgiving cliff.
Here's a quick look at how the average app loses users over the first month. This is the baseline you're trying to beat.
The Typical User Drop-Off Funnel
| Time After Install | Average User Retention Rate | What This Means for You |
|---|---|---|
| Day 1 | ~25% | Three out of four users are gone after the first day. Your onboarding is critical. |
| Day 7 | ~12% | Only about one in ten users makes it through the first week. |
| Day 30 | ~8% | Less than 10% of your install base is still active after a month. |
This steep decline isn't an anomaly—it's the norm. The data consistently shows that most apps lose over 90% of their daily active users within the first 30 days. Beating this average is the first step toward sustainable growth.
Building a solid foundation for retention means delivering a great experience at every turn. It’s about creating a seamless omnichannel customer experience where every interaction feels connected.
It's also about making people feel like they belong. We've put together some actionable community engagement best practices that can help with that. Getting these fundamentals right is crucial before we jump into the formulas and strategies up next.
Alright, let's get down to the nitty-gritty of actually calculating your retention rate. Enough with the theory—it's time to crunch some numbers.
Don't worry, you don't need a Ph.D. in data science for this. At its core, calculating retention is all about answering one simple question: "Of all the people who signed up on a certain day, how many of them actually came back later?"
Answering that question is how you find out if your app has real staying power or if it's just a leaky bucket. Let's break down the formulas and methods you'll need.
The Basic Formula: N-Day Retention
The most common starting point for measuring retention is called N-Day Retention. This metric tells you what percentage of users came back on a specific day after their first visit. It’s a clean, simple snapshot.
The formula is super straightforward:
(Number of users who came back on Day N) / (Number of users who signed up on Day 0) * 100%
Let's make that real. Say 1,000 people downloaded your app on Monday (that's Day 0). If 250 of them opened the app again on Tuesday (Day 1), your Day 1 retention is 25%. If only 100 of that original group came back the following Monday (Day 7), your Day 7 retention would be 10%.
This gives you a clear benchmark, but looking at these numbers in a vacuum only tells you part of the story. To really understand what's going on, you need to group your users together.
Getting Granular with Cohort Analysis
This is where things get really insightful. A cohort is just a fancy word for a group of users who share a common trait. Most of the time, that trait is when they signed up. A cohort analysis, then, is just tracking how these specific groups behave over time.
Think of it this way: instead of taking the overall temperature of a huge room, you're putting thermometers in different corners. The average temperature might seem okay, but you could have one corner that's freezing and another that's boiling hot. You'd never know without checking each zone.
For a Web3 project, you could group users into cohorts based on things like:
- How they found you: Did they come from a specific airdrop campaign?
- What they did first: Did they mint their first NFT within 24 hours?
- When they joined: Everyone who signed up in the first week of October.
By tracking these groups separately, you can finally see what moves the needle. Did that airdrop cohort stick around longer than users from a paid ad campaign? You just can't get that level of detail from a single, blended retention number. If you want to dive deeper into tracking user actions, our guide on how to measure community engagement is a great next step.
How to Read a Cohort Chart
A cohort chart is the classic way to visualize all this data. It usually looks like a triangle-shaped grid. Each row represents a different cohort (e.g., "Week 1 Signups"), and the columns track time since they joined (Day 1, Day 7, Day 30, etc.).
The cells are color-coded based on the retention percentage, usually fading from a dark color (high retention) to a light one (low retention).
If your chart fades to white almost immediately, you're looking at a "triangle of death"—a sign that users are leaving and not coming back. A healthy chart has strong color that stretches across the rows. The ultimate goal is to turn that fading triangle into a solid rectangle, or even better, a "smile" where retention dips but then comes back up as you win users back.
Understanding Retention Benchmarks Across Industries
So you’ve figured out your app’s user retention rate. That's a great start, but what does that number actually mean? A "good" retention rate doesn't exist in a vacuum. It’s all about context. The type of app you've built, its business model, and what users expect from it all play a massive role in what success looks like.
Trying to compare a DeFi protocol to a casual mobile game is like comparing apples and oranges. One involves managing people's hard-earned money, which demands a high level of trust and frequent check-ins. The other is a fun distraction, easily swapped out for the next big thing. That’s why a 10% Day 30 retention might be a huge win for the game but a five-alarm fire for the DeFi app.
To set goals that make sense, you have to see how you measure up against your direct competitors and the industry at large. This keeps you from either panicking over numbers that are totally normal for your niche or, even worse, getting complacent with a rate that’s secretly lagging way behind.
A Look at Retention Across App Categories
The difference in retention from one industry to the next can be pretty staggering. It just turns out that some app categories are naturally "stickier" than others because of the service they provide.
Think about it: apps that weave themselves into our daily habits or manage high-stakes information—like finance or news apps—tend to keep users around for much longer. Research from Statista paints a really interesting picture here. News apps are at the top of the heap with almost 10% Day 30 retention, while entertainment and social media apps often see their user base drop below 3% after just one month. You can dig into these industry retention benchmarks on Statista.
This data reveals a massive opportunity for Web3 projects, which have the potential to blend different engagement models to create something truly sticky.
Here’s a simple way to visualize how you can approach your own retention analysis, moving from basic measurement to real, actionable insights.
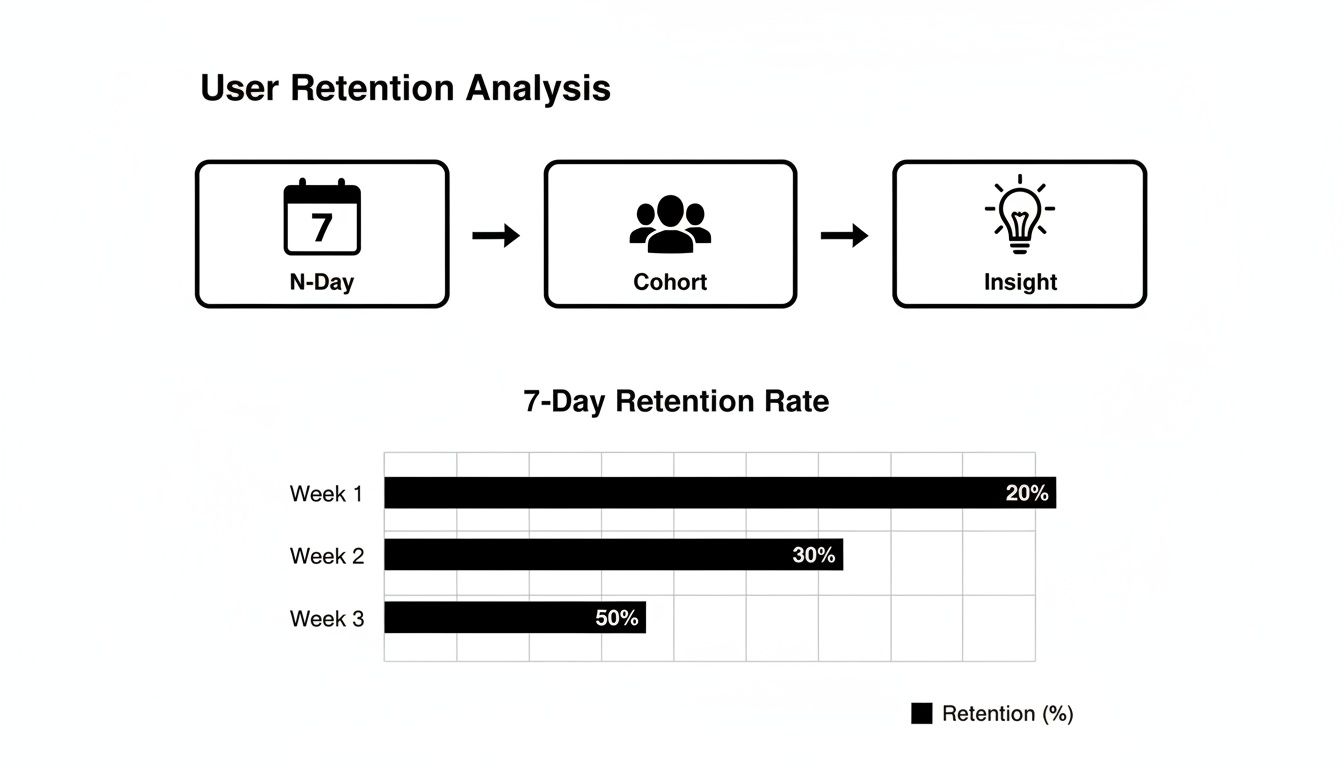
By breaking down retention by different timeframes (like N-Day) and user groups (cohorts), you can find the specific clues you need to build long-term loyalty.
Where FinTech and Marketplaces Shine
FinTech is a top performer, and it’s no surprise why—money is a pretty strong reason to keep coming back. Banking apps, for example, post impressive numbers, holding on to 11.6% of their users at Day 30.
A user checking their crypto portfolio every day is showing a completely different kind of behavior than someone opening a game to kill a few minutes. The value they get is on another level, which naturally drives a higher app user retention rate.
This high-utility model is exactly what many Web3 projects should be shooting for. Marketplaces are another strong category, although even they’ve seen a small dip in retention lately, with Day 30 rates slipping from 9% to 8%.
Here’s a quick rundown to put it all into perspective:
- Fintech (Banking): 11.6% Day 30 Retention
- News: ~10% Day 30 Retention
- Marketplaces: 8% Day 30 Retention
- Productivity: 4.1% Day 30 Retention
- Social Media: <2% Day 30 Retention
Knowing these benchmarks is the first step toward building a strategy that works. It helps you set achievable goals and figure out which levers—whether it's community, utility, or financial incentives—are most likely to move the needle in your corner of the market. For Web3, the ultimate goal is often to combine the high-stakes engagement of finance with the viral, community-driven loops of social platforms.
Common Pitfalls That Absolutely Wreck User Retention
It’s one thing to know your app's retention numbers, but it’s a whole different ballgame to stop them from dropping. Before you can even think about building a winning strategy, you have to spot the subtle mistakes that are quietly pushing your users away.
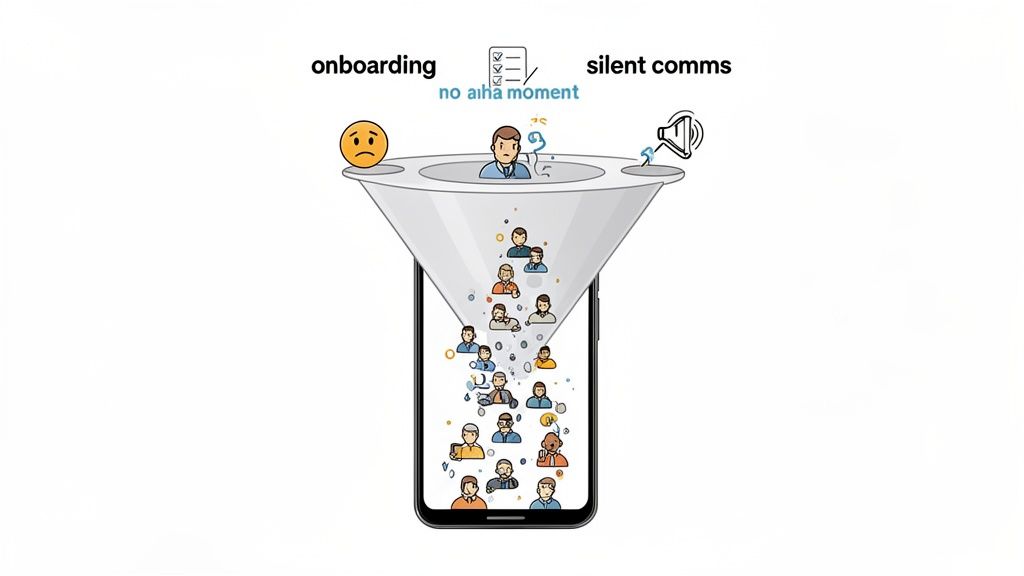
These aren't always the big, obvious problems like a buggy interface or terrible load times. More often, they're the silent killers of retention—small bits of friction that build up until a user just… stops opening your app. It's like throwing an amazing party but forgetting to tell anyone where it is or what to do when they get there. People are going to get bored and leave.
Your Onboarding Experience Is a First Date
You get one shot to make a good first impression, and that’s your onboarding flow. If it’s confusing, too long, or feels like a chore, you’ve basically already lost. Users need to “get” your app’s core value almost instantly.
A classic mistake is hitting them with a wall of permission requests, long sign-up forms, or a complicated tutorial before they’ve even seen the main screen. This creates immediate resistance and kills any excitement before it even has a chance to build.
The goal of onboarding isn't to show off every single feature you've built. It's to guide the user to their first "aha!" moment as quickly and smoothly as possible. This first small win is what makes them want to come back for a second date.
For example, instead of forcing them through a ten-step tour, why not guide them to complete one simple, rewarding action? That immediate hit of accomplishment is a powerful hook that can make a huge difference in your Day 1 retention.
You're Not Delivering Value Fast Enough
Let's be honest, modern users don't have a lot of patience. They download an app to solve a problem or get something they want now, not after twenty minutes of tapping around trying to figure it out. If your app’s magic is buried behind a clunky UI or a bunch of extra steps, they’re gone.
You have to answer their unspoken question—"What's in it for me?"—within the very first session. A user who doesn't experience the core benefit of your app on their first visit is almost certainly not coming back for a second.
This is where design plays a huge role. To avoid these kinds of traps from the start, it pays to follow established mobile app design best practices.
Your Communication Is Annoying or Irrelevant
Once you’ve got a user on board, the next challenge is keeping them interested. This is where so many apps drop the ball, either by spamming users with generic push notifications or by going completely silent. Both are death sentences for your retention rate.
Good communication means sending the right message to the right person at the right time. It's that simple. Here are a few things to stop doing immediately:
- Generic Blasts: Stop sending the exact same notification to every single user. It's lazy and it doesn't work.
- Terrible Timing: Nobody wants an alert from your app in the middle of the night.
- No Real Value: Notifications that just say "We miss you!" are self-serving. Offer something useful, like a personalized tip or an exclusive reward.
A smart communication strategy that’s based on how people actually use your app makes them feel seen and valued. And that’s what keeps them coming back.
A Web3 Playbook for Boosting App User Retention
Alright, let's move from theory to action. It's time to swap abstract ideas for a practical playbook built for Web3 marketers and community builders. The goal is simple: get your app user retention rate up by creating an experience so good that users can't help but come back for more.
This whole playbook is built on Web3-native ideas—things like on-chain actions and real community ownership—to create a user loop that’s hard to break. The secret sauce? Gamified, reward-based quests that give people a clear reason to show up every single day.
Designing a Web3 Retention Engine
Let’s be honest, traditional retention tactics feel clunky and out of place in Web3. A generic "we miss you!" push notification just doesn't hit the mark anymore. What you really need are interactive experiences that reward people for what they do both on-chain and off-chain, turning them from passive observers into active, loyal community members.
This is exactly where a no-code toolkit like Domino comes in clutch. It lets you design quests that are actually compelling because they blend different user actions together seamlessly. You can finally move past just asking for a follow on social media and start building sophisticated campaigns that drive real engagement and, most importantly, improve your retention metrics.
Here are a few quick ideas for blended quests you could build:
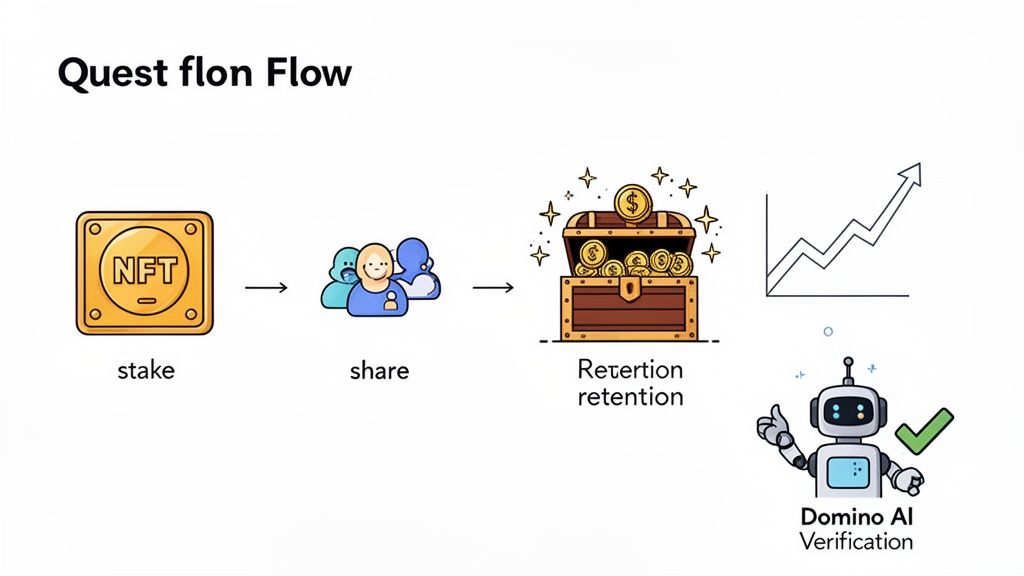
- On-Chain Meets Social: Have users stake an NFT, then share a screenshot of it on Twitter with your project’s hashtag. This ties a core protocol action directly to social proof.
- Protocol Engagement: Create a quest that rewards users for making their first swap on your DEX, then hopping into a specific Discord channel to talk about their experience.
- Community Building: Ask users to vote on a governance proposal (on-chain) and then write a quick post in your forum explaining why they voted the way they did (off-chain).
Automating the Experience with AI
Imagine trying to manually verify thousands of quest submissions. It's a nightmare. This is where automation isn't just nice to have; it's essential. Domino’s AI verification system does all the heavy lifting, automatically confirming that users actually completed the tasks—from checking tweets to validating on-chain transactions.
This creates a smooth, frictionless experience for everyone. Your users get that awesome hit of instant gratification with immediate rewards, and your team gets to focus on dreaming up the next great campaign instead of being buried in admin work. What you end up with is a scalable system that keeps people engaged without burning out your crew. It's an organic, activity-driven approach that's way more cost-effective than just buying more users.
It turns out, organic users stick around longer anyway. A Liftoff analysis of over 5 billion clicks found that day-30 organic retention is 3.8%, compared to just 3.2% for non-organic users. It really shows the value of building genuine engagement. You can dive deeper into these mobile app retention statistics to see the full picture.
Actionable Quest Ideas for Key Drop-Off Points
To make this playbook even more concrete, let's talk about using targeted quests to fight churn when it’s most likely to happen. The right incentive at just the right moment can easily turn someone who's about to leave into a long-term fan.
Here’s a breakdown of how you can use Domino to tackle those critical drop-off points with specific quests.
Domino Quest Ideas to Target Key Retention Periods
| Retention Period | The Problem | Domino Quest Solution Example |
|---|---|---|
| Day 1 | Weak Onboarding: Users don't get that "aha!" moment and see no compelling reason to come back tomorrow. | Launch a "Welcome Aboard" quest. Have users connect their wallet, follow you on X, and join Discord to claim a small, instant reward. It’s an easy, immediate win. |
| Day 7 | Value Drop-Off: The initial excitement has faded, and users need a deeper reason to stay involved. | Create a "Weekly Ritual" quest. Reward users for doing a core on-chain action, like staking or providing liquidity, at least once during the week. |
| Day 30 | Habit Fails to Form: Your app isn't part of their routine yet, and they're starting to forget about it. | Introduce an "Expert User" campaign. Design a multi-step quest that walks them through an advanced feature, unlocking a special NFT or a unique role when they finish. |
By strategically rolling out these kinds of quests with a tool like Domino, you can systematically plug the leaks where users typically fall off. You’re not just hoping they stick around; you're actively turning their journey into an interactive game that builds the kind of deep loyalty that drives a healthy app user retention rate.
If you're looking for more ways to build that kind of die-hard community, check out our guide on creating powerful Web3 loyalty programs.
Got Questions About App User Retention? We've Got Answers.
Jumping into app analytics can feel like you’re trying to decipher a secret code. One of the most common, and often confusing, terms you'll run into is app user retention rate.
To cut through the noise, we've rounded up the questions we hear most often from founders and marketers. Think of this as your go-to FAQ for getting the basics right.
What Is a Good App User Retention Rate?
This is the million-dollar question, and the honest answer is: it depends. There’s no universal “good” number. The benchmark for a social app is completely different from a crypto wallet, and factors like your platform and user acquisition channels all play a part.
That said, there's a handy rule of thumb in the industry known as the 40-20-10 rule:
- 40% of users come back on Day 1.
- 20% of users come back on Day 7.
- 10% of users come back on Day 30.
If your numbers are hitting these targets, you’re generally in a good spot and likely doing better than the average app. For Web3 projects specifically, a great goal is to crush the Day 30 retention of a typical social media app, which can be as low as 2%.
How Can I Improve My Day 1 Retention Rate?
Day 1 retention is all about the first impression. It lives and dies by your onboarding flow. Your one and only job is to get users to their "aha!" moment—that flash of understanding where they get why your app is awesome—as quickly as humanly possible.
To pull this off, you need to create a totally frictionless first session. Think simple sign-ups, a quick tutorial that showcases your core value (not every single feature), and giving the user an immediate "first win."
In Web3, a simple welcome quest is a perfect example. A user connects their wallet, follows you on X, and instantly claims a small on-chain reward. That positive feedback loop is a powerful hook that makes them want to see what's next.
What Is the Difference Between Retention and Engagement?
It’s easy to mix these two up, but they measure very different things.
Retention is binary. It just tells you if a user came back or not. It answers the simple question: "Did they return?"
Engagement, on the other hand, measures what people are actually doing inside your app. It answers the question: "Are they using the key features?"
High engagement is usually a great sign for retention, but you can have one without the other. For example, a user might open your app every day just to check a token price (high retention) but never actually perform a swap or interact with your protocol (low engagement). The real goal is to drive retention because of meaningful engagement.
Should I Focus on Acquisition or Retention?
Ah, the classic growth debate. When you're just starting out, you obviously need users. You can't retain people you don't have, so acquisition is critical.
But focusing only on getting new users is like pouring water into a leaky bucket. It's expensive, exhausting, and you'll never actually fill it up. It is almost always cheaper to keep a user you already have than to find a new one.
Adopting a "retention-first" mindset builds a strong foundation for sustainable growth. Happy, retained users spend more over their lifetime (higher LTV) and eventually become your best marketers, driving organic growth through word-of-mouth. The most successful projects strike a balance, but they never forget that retention is the bedrock everything else is built on.
Ready to put these ideas into practice? With Domino, you can build the engaging, reward-based quests that boost your app user retention—all without writing a single line of code. Design your first campaign in minutes.