Measuring Marketing Campaign Effectiveness: Tips & Strategies

Figuring out if your marketing is actually working means looking past vanity metrics like likes and shares. You've got to dig deeper into the data that really moves the needle for your business. It's all about drawing a straight line from your marketing spend to real-world results like revenue, customer acquisition cost, and, of course, your return on investment (ROI). This is how you make sure your budget is fueling growth, not just making noise.
Why Measuring Marketing Effectiveness Is a Must
Let's be real—throwing money at marketing without knowing what's effective is like driving blindfolded. Sure, you're moving, but who knows if you're heading for a cliff or the finish line. In today's market, understanding campaign performance isn't just a nice-to-have; it's essential for survival.
Every click, view, and interaction can be tracked. Relying on gut feelings when you have that much data available is just asking for trouble. Data-driven insights are what separate the campaigns that soar from those that just sputter along.
The Real Cost of Not Measuring
Ignoring measurement isn't just about having a blurry picture of your performance. When you don't track what's working, you're basically just gambling with your marketing budget. This opens the door to some pretty serious problems.
- Wasted Budgets: You could be pouring cash into channels that bring in nothing while your most promising revenue drivers are starved for funds.
- Missed Opportunities: Without solid data, you can't see what's trending or figure out which messages are actually hitting home with your audience. That means leaving money and customers on the table.
- Lack of Justification: When the boss asks for a progress report, "we got a lot of impressions" isn't going to cut it. You need cold, hard numbers to prove marketing’s value and get your budget approved for next quarter.
At the end of the day, if you aren't measuring, you aren't learning. You can't adapt, and you certainly can't improve. Each campaign becomes a one-off shot in the dark instead of a calculated step in a smarter, evolving strategy.
The Shift to a Data-First Mindset
The marketing world has gone digital. That's not a trend—it's a complete rewiring of how businesses find and connect with customers. Online channels now pull in about 72.7% of all advertising dollars worldwide, which tells you everything you need to know about where the action is.
Here in the U.S., digital makes up a whopping 69% of total ad spend. Marketers are clearly putting their money on search, social, and video. This massive shift makes sharp, accurate measurement more crucial than ever. You have to be able to justify the ROI across a dizzying number of channels.
"Most marketing campaigns fail at the measurement stage, not the execution stage. Your creative might be brilliant, your targeting precise, and your timing perfect. Yet, you still can't prove it worked. The reason? You likely defined success after launching instead of before."
This new reality demands a new mindset. Success isn't just about clever creative anymore; it's about turning that creativity into numbers on a spreadsheet. For a deeper dive into these core concepts, you can find some great additional info on how to measure advertising effectiveness. This kind of foundational knowledge is what helps you connect every dollar you spend to a clear, tangible result.
This guide is here to help you build that foundation and finally move from guessing to knowing.
Setting Goals That Actually Mean Something
Before you can measure anything, you have to know what success looks like. It’s a simple idea, but it’s where most marketing measurement falls apart. We get so caught up in flashy numbers like impressions and follower counts that we forget to ask the most important question: "What are we actually trying to achieve?"
Vague goals like "boost awareness" or "increase engagement" sound great in a meeting, but they're useless for measurement. They don't give you a clear target. A campaign that gets a million impressions but zero leads might look good on paper, but it does absolutely nothing for the bottom line.
Moving Beyond Vanity Metrics
I once ran a campaign where we celebrated hitting a massive reach number on social media. The team was ecstatic, and the vanity metrics were through the roof. But when we dug into the sales data two weeks later? Crickets. We'd attracted a huge audience of people who liked our content but had zero intention of ever buying from us.
That experience taught me a hard lesson. True success isn't about activity; it's about outcomes. Measuring your marketing effectiveness starts by defining those outcomes with absolute clarity. This is where the classic SMART goal framework is still incredibly useful, but I like to apply a practical twist.
- Specific: What exact action do you want people to take? Don't just "generate leads." Aim to "generate 200 qualified demo requests from our target enterprise segment."
- Measurable: How will you track it? This means defining your Key Performance Indicators (KPIs) before you spend a single dollar.
- Achievable: Is the goal realistic with your budget and timeline? Setting an impossible target just demoralizes your team.
- Relevant: Does this goal directly help the business grow? Think revenue, market share, or user retention.
- Time-bound: When does the campaign start and end? A clear timeframe creates urgency and a defined window for measurement.
Don't let your team fall in love with metrics that don't matter. A goal is only meaningful if it connects directly to a business outcome. If you can't draw a straight line from your KPI to revenue or user growth, you're probably tracking the wrong thing.
Choosing KPIs That Connect to Business Objectives
The KPIs you choose are the vital signs of your campaign. Picking the right ones is crucial for getting a true read on performance, while the wrong ones can send you down a completely misleading path. Your campaign goal should always dictate your KPIs—not the other way around.
To get this right, you have to connect the dots between your broader objective and the specific metrics that prove you're getting there. Here’s a quick breakdown of how that looks in practice.
Matching Campaign Goals to Relevant KPIs
| Campaign Goal | Primary KPI | Secondary KPIs | Example |
|---|---|---|---|
| Brand Awareness | Reach & Impressions | Social Mentions, Website Traffic | A new product launch campaign aims for 5 million impressions in the first month. |
| Lead Generation | Cost Per Lead (CPL) | Conversion Rate, MQLs | A webinar campaign's goal is a CPL of under $50. |
| Customer Acquisition | Cost Per Acquisition (CPA) | Return on Ad Spend (ROAS) | An e-commerce brand wants to achieve a $25 CPA on its Google Ads. |
| User Engagement | Session Duration | Pages Per Session, Return Visits | A content marketing initiative aims to increase average session duration by 20%. |
This table is a starting point. The key is to have a primary KPI that directly reflects your main goal, supported by secondary metrics that provide a more complete picture of performance.
If your main focus is on lead generation, your primary KPI isn't website traffic; it’s the Cost Per Lead (CPL) or the number of Marketing Qualified Leads (MQLs). For startups looking to scale quickly, understanding these nuances can be a game-changer. Our guide on powerful user acquisition strategies for startups offers more detail on how to align your goals with growth tactics.
The chart below shows just how different channels can perform against bottom-line metrics like Return on Investment (ROI) and Cost Per Acquisition (CPA).
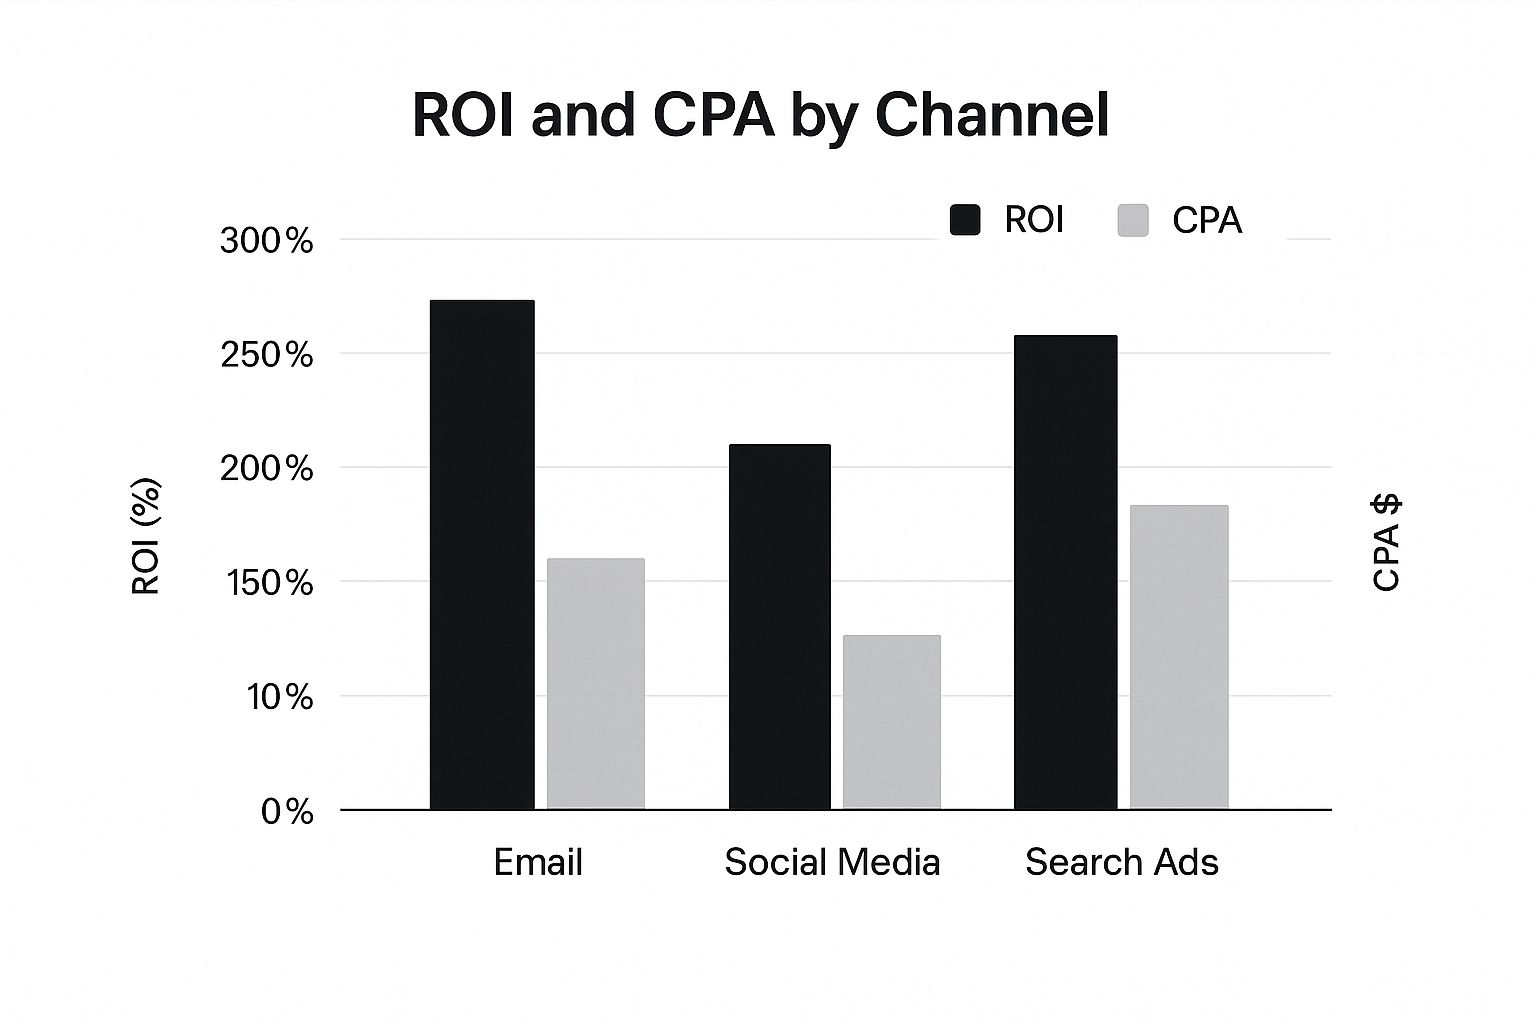
As you can see, while Search Ads might have a higher CPA, their ROI can significantly outperform other channels. This is exactly why you need to look at multiple KPIs to get the full story.
Ultimately, your goal-setting process has to be a team sport. Sit down with your team and stakeholders before the campaign launches. Agree on what success looks like and how you’ll all measure it. This alignment ensures everyone is working toward the same finish line and stops you from scrambling to justify results after the fact.
Picking the Right Tools to Gather Your Data

Okay, you’ve got your goals locked in. Now for the fun part: the tech. Choosing the right tools is where the rubber meets the road, turning those KPIs you just defined into real, tangible numbers you can actually track.
Think of it this way: your marketing toolkit is your cockpit. Without the right gauges, you’re flying completely blind. You need a solid mix of tools that can follow the entire customer journey, from that very first ad click all the way to the final sale—and every little touchpoint in between.
The Must-Have Analytics Toolkit
Every single marketer needs a strong foundation for seeing how people interact with their brand online. These are the absolute non-negotiables that give you a baseline read on what’s actually happening.
- Google Analytics (GA4): There's a reason it's the industry standard. It’s free, incredibly powerful, and gives you a deep dive into your website traffic. GA4 is essential for figuring out where visitors are coming from, what they do once they arrive, and which pages are actually turning them into customers.
- Platform-Specific Analytics: Don't sleep on the analytics built right into platforms like Meta Business Suite, Google Ads, or whatever email service you use. They provide super-specific data on how your campaigns are doing within their own worlds—things like ad reach, click-through rates, and email open rates.
- UTM Builders: A simple tool, but a mighty one. Tacking UTM parameters onto your campaign URLs tells Google Analytics exactly where your traffic is originating. This small step makes attributing conversions way, way more accurate.
These foundational tools are your starting point. They give you the raw numbers, but to get the full story, you’ll need to connect them to the bigger picture.
Moving Beyond the Basics with Specialized Tools
While the core tools are great, they often create data silos. Having your ad data in one place and your website data in another makes it nearly impossible to see how a customer really behaves. This is where specialized tools step in to connect the dots and do some of the heavy lifting for you.
A CRM (Customer Relationship Management) system like HubSpot or Salesforce is a game-changer. It becomes the central source of truth for every customer interaction, linking marketing touchpoints directly to sales data. This is how you finally connect that lead from a specific ad campaign to the actual revenue they brought in.
Marketing automation platforms take this even further. They don't just track what people do; they help you nurture leads and manage complex campaigns across multiple channels. Getting this holistic view is crucial, especially when you're juggling several campaigns at once. If you’re trying to make this process smoother, our guide to multi-channel campaign management has some great, practical strategies.
The best tech stack isn't the one with the most bells and whistles. It's the one that gives you a single, accurate view of the customer journey without making more work for your team. Simplicity and solid integration are everything.
Make Sure Your Data is Clean and Reliable
A flashy new tool is completely worthless if the data it’s spitting out is garbage. Data integrity—making sure your numbers are clean, accurate, and consistent—is everything. A single tracking error can send your entire analysis off course and lead you to make some truly awful decisions.
Get into the habit of regularly auditing your tracking setup. Are your analytics tags firing correctly on every single page? Are your conversion goals configured properly? A quick spot-check can save you from a world of hurt later on.
This focus on technology and clean measurement isn’t just a nice-to-have; it's a global trend. Businesses everywhere are increasing their marketing budgets, and a huge chunk of that is going straight to MarTech. They know that investing in the right tools is the only way to prove ROI and get the most out of every dollar spent. You can explore the latest data on global marketing spending from Statista to see just how data-driven strategies are shaping modern budgets.
Once you’ve thoughtfully picked your tools and made sure your data is clean, you’ve set the stage for the most important part: turning all those numbers into smart insights that fuel real growth.
Turning Data Into Actionable Insights
So, you’ve gathered all this data, and your dashboards are practically glowing. Great. But numbers are just numbers until you figure out what they’re trying to tell you. This is the fun part—where we stop being data janitors and start being data detectives, connecting the dots to see what’s actually working.
Looking at surface-level metrics like impressions or website traffic only gives you a tiny piece of the puzzle. The real insight comes from digging in, spotting trends, and figuring out which parts of your campaign are gold and which are just costing you money. This is how you turn a spreadsheet into a strategy.
Demystifying Marketing Attribution
Let's be real: figuring out what actually led to a sale is one of the toughest parts of marketing. A customer might see your ad on social media, read a blog post a few days later, and then finally click a retargeting ad to buy something. So, who gets the credit?
That’s where marketing attribution models come in. Think of them as different rulebooks for giving credit to the various touchpoints in a customer's journey.
- First-Touch Attribution: This one’s simple. It gives 100% of the credit to the very first thing a customer ever did with your brand. It’s perfect for figuring out which channels are kicking off the customer journey and bringing new people into your world.
- Last-Touch Attribution: The complete opposite. All the credit goes to the final click before the conversion. It’s easy to track but often misses the crucial steps that warmed up the lead in the first place.
- Linear Attribution: This model is the diplomat—it gives equal credit to every single touchpoint. It’s fair, but it can water down the impact of the most influential moments.
- Time-Decay Attribution: This is a bit more sophisticated. The interactions closest to the sale get the most credit. The logic here is that the touchpoints that happened right before the purchase were probably the most persuasive.
Which one is right for you? It completely depends on your campaign and your sales cycle. If you're selling something with a short, impulsive buying cycle, last-touch might be all you need. But for a longer, more considered purchase, a linear or time-decay model will paint a much more accurate picture.
Calculating Your Core Financial Metrics
Attribution tells you about the journey, but you still need to know if you're making money. That's where two key metrics come in: Return on Investment (ROI) and Customer Acquisition Cost (CAC). Don't let the acronyms scare you off; the math is actually pretty straightforward.
The real goal here isn’t just to see if you made more than you spent. It’s about understanding how well your marketing machine is actually running—and which parts are most efficient at turning dollars into profit.
Here are the formulas you can start using right away:
Customer Acquisition Cost (CAC):
This tells you, on average, what you’re paying to get one new customer.
CAC = Total Marketing Spend / Number of New Customers Acquired
Say you spent $5,000 on a campaign that brought in 100 new customers. Your CAC would be a clean $50.
Return on Investment (ROI):
This is the big one—the ultimate measure of profitability.
ROI = [(Revenue from Campaign - Total Marketing Spend) / Total Marketing Spend] x 100
Using that same example, if your $5,000 campaign brought in $20,000 in revenue, your ROI is a whopping 300%. That means for every dollar you invested, you got four dollars back. Not bad at all.
From Analysis to Action
Once you have these numbers, you can start making genuinely smart decisions. For example, by turning data into actionable insights, you might discover that you need to implement some strategies to reduce cart abandonment because a ton of users are dropping off right at the checkout page. Suddenly, you know exactly where to focus your energy.
Or, if you’re running a Web3 project, you might find that people are constantly getting stuck on a particular step in your onboarding quests. That’s a clear signal to go fix the friction. If you want to go deeper on this, check out our guide on how to measure community engagement.
The whole point is to move beyond just reporting numbers. Your true value comes from interpreting what those numbers mean for the business and recommending clear, data-driven next steps. This is how you prove that marketing isn't just a cost center—it's the engine that powers growth.
Using Your Insights for Constant Improvement

Here's the thing about measuring your marketing campaigns: the real magic isn't in creating a report card for what you’ve already done. It’s about building a roadmap for what you’ll do next. Data that just sits on a dashboard is a massive wasted opportunity.
The goal is to close the loop—turning those numbers into a cycle of constant, intelligent improvement. You’re not just analyzing the past; you're actively shaping the future of your marketing. Every insight you find should spark a new hypothesis, a fresh test, or a smarter decision. It’s a total mindset shift from "launch and pray" to a proactive culture of learning and iterating.
Iterating with A/B Testing
One of the most direct ways to put your insights into action is with A/B testing. Instead of making huge, risky changes based on a hunch, you can make small, controlled tweaks and see what actually works. It's the scientific method, but for marketing.
Let's say your data shows a landing page gets tons of traffic but has a dismal conversion rate. Don't scrap the whole page. Form a hypothesis. Maybe the headline isn't grabbing anyone, or the call-to-action (CTA) button is the wrong color.
So, you create a variation (Version B) with a punchier headline and run it against the original (Version A). By splitting your traffic between the two, you can see which one performs better with real, statistical confidence. This pulls all the guesswork out of the equation and helps you build a library of proven tactics you can use everywhere.
A/B testing isn't just about finding a "winner." It's about understanding why that version won. Every test, win or lose, teaches you something valuable about what makes your audience tick.
Turning Small Wins into Strategic Shifts
Sometimes, your analysis will point to bigger patterns that need more than a simple A/B test. For example, you might notice that your user-generated content (UGC) campaigns consistently blow your branded content out of the water. That's a huge signal to shift your strategy.
We see this all the time. Social media marketing effectiveness is often proven through raw engagement and ROI, and UGC often delivers much higher click-through rates because it feels more authentic. Digging into platform-specific ROI is also crucial; for many brands, Facebook and Instagram still lead the pack because they’re built for visual storytelling. By leaning into these data-backed insights, you can start making strategic moves, like investing more in influencer marketing or focusing on the platforms that actually deliver results. You can explore more social media marketing benchmarks to see how your own efforts stack up.
An insight like this shouldn't just lead to one more UGC campaign. It should spark a bigger conversation with your team:
- How can we make it dead simple for our community to create and share content?
- Should we start featuring more user content on our website and in our ads?
- Is it time to build a formal ambassador program to really encourage this?
This is how a single data point can grow into a cornerstone of your marketing strategy—no need to tear everything down and start from scratch.
Creating Reports That Actually Get Read
Look, your hard work digging through data is worthless if no one acts on it. A 50-page report crammed with jargon and endless charts is just going to collect digital dust. The secret is to create performance reports that tell a clear story and push people toward a decision.
Always start with the "so what?" What's the single most important thing you learned? Lead with that. Use clean visuals like charts and graphs to make complex data easy to understand at a glance.
A simple, logical structure works best:
- Executive Summary: A quick paragraph covering the main finding and your top recommendation.
- Key Performance Highlights: Use bullet points to show off the most important metrics and how they tracked against your goals.
- Wins and Learnings: What went really well? And what did you learn from the things that flopped?
- Actionable Recommendations: What specific, data-backed actions should the team take next?
By focusing on clarity and action, you turn your report from a boring summary into a powerful tool for change. You’re not just showing numbers; you’re guiding your team toward smarter, more effective marketing.
Common Questions We Hear About Measuring Campaigns
Even with the best plan, you're going to have questions once you're in the weeds of measuring a marketing campaign. It’s one thing to have your KPIs and tools set up, but real life is messy and doesn't always fit into a perfect spreadsheet. Let's dig into some of the most common hurdles people face.
How Long Before I Can Actually Measure a Campaign?
This is the big one, and the only honest answer is: it depends on your sales cycle.
If you’re an e-commerce brand slinging low-cost products, you might see a clear picture in just a few days. But if you’re a B2B SaaS company with a six-month sales cycle, yanking a campaign after two weeks because sales haven't spiked would be a massive mistake.
Here’s a practical way to approach it:
- For quick wins: Start peeking at lead metrics like Cost Per Lead (CPL) and initial conversion rates within the first week.
- For the long haul: For the first month, keep your eyes on top-of-funnel KPIs—things like traffic, engagement, and marketing-qualified leads (MQLs). You need to give the campaign at least one full sales cycle before you can make a real judgment on its ROI.
The worst thing you can do is measure a long-term strategy with a short-term ruler. Your campaign needs time to breathe and let its effects work their way through the entire customer journey.
What’s a "Good" Conversion Rate, Anyway?
Everyone wants that magic number for a "good" conversion rate, but industry benchmarks can be a real trap. A 2% conversion rate might be cause for celebration in one niche and a total disaster in another.
Stop chasing universal averages and start building your own benchmarks. The only comparison that truly matters is you vs. you. If your last campaign converted at 1.5%, and this new one is hitting 1.8%, that's a genuine win. Celebrate that progress.
Remember, context is king. A "Request a Demo" conversion is way more valuable than a "Download a Free PDF," so don't be surprised when their conversion rates look wildly different.
How Do I Prove a Brand Awareness Campaign is Working?
Measuring brand awareness can feel like trying to nail Jell-O to a wall. The goal isn't a direct sale, so you have to look for different signals to see if you're making an impact.
You're looking for metrics that prove your brand's footprint is growing and that you're starting more conversations.
- Reach and Impressions: This is your foundation. Are more eyeballs on your content than before?
- Website Traffic: Look for a lift in direct traffic or branded searches (people typing your company name into Google). That’s a sign they’re actively looking for you.
- Social Mentions: Keep tabs on how often your brand is being discussed online. A spike in untagged mentions—where people talk about you without using your @handle—is a golden indicator.
These don't have a neat dollar sign attached to them, but they are absolutely leading indicators of future growth. A killer awareness campaign today makes for much easier conversions tomorrow.
Ready to stop guessing and start knowing what drives your Web3 community? Domino gives you the toolkit to design, launch, and measure reward-based campaigns that actually work. Automate on-chain and off-chain task verification, accelerate user acquisition, and prove your marketing ROI without writing a single line of code.