How to Measure ROI Marketing and Prove Your Value

Measuring your marketing return on investment (ROI) comes down to a pretty simple truth: you need to prove the money you're spending is actually making the company more money.
The classic formula is (Sales Growth - Marketing Cost) / Marketing Cost. Once you get a handle on this, marketing stops being a line item expense and starts being a smart, data-driven investment strategy.
Why Nailing Your Marketing ROI Is a Game Changer
Let's be real for a second. Marketing without measurement is just hoping for the best. It's expensive guesswork. In the world we live in now, every single dollar has to pull its weight.
Gone are the days when you could ask for a bigger budget based on a gut feeling. Today's leadership wants to see the numbers. Knowing how to measure your marketing ROI isn't just a "nice-to-have" skill anymore—it’s crucial for keeping your job and growing your department.
When you truly understand your return, the entire conversation changes. You're no longer just asking for budget. You’re building a business case. You can walk into that boardroom and say, "For every dollar we put into our Web3 community quests, we brought in five dollars of new customer revenue."
That kind of clarity builds incredible trust. It repositions the marketing team from a cost center to a core part of the revenue engine.
The Growing Demand for Accountability
The pressure to justify marketing spend is only getting more intense. When budgets get tight, the first question from the C-suite is always, "What did we actually get for that money?"
This isn't just a passing trend; it's a permanent shift. As of 2025, a whopping 83% of marketing leaders said that demonstrating ROI was their number one priority. That’s a huge jump from just 68% five years ago. You can dig into more of these marketing ROI statistics to see just how critical this has become.
This means you absolutely need a clear, defensible answer when that question comes.
Knowing your ROI helps you:
- Defend Your Budget: You can confidently show which campaigns are killing it and why they deserve more funding.
- Optimize Your Strategy: It becomes easy to see which channels are winners, so you can double down on what works and cut the dead weight.
- Make Smarter Decisions: Past ROI data is your crystal ball for forecasting future campaigns and allocating your resources wisely.
Before we dive deeper, let's get familiar with some of the key terms you'll be using. This isn't just jargon; it's the language of effective marketing measurement.
Key Metrics for Your ROI Toolkit
A quick look at the core metrics you'll need to get comfortable with before you can accurately calculate your marketing ROI.
| Metric | What It Measures | Why It's Critical for ROI |
|---|---|---|
| Customer Acquisition Cost (CAC) | The total cost to acquire a single new customer. | You need to know how much you're spending to get a customer before you can tell if they're profitable. |
| Customer Lifetime Value (LTV) | The total revenue a single customer is predicted to generate over their entire relationship with your brand. | This is the "return" part of ROI. A high LTV means your marketing is attracting valuable, long-term customers. |
| Conversion Rate | The percentage of users who take a desired action (e.g., sign up, make a purchase). | This tells you how effective your marketing is at turning interest into action. Higher conversion = better ROI. |
| Attribution | The process of identifying which marketing touchpoints led to a conversion. | Without attribution, you're flying blind. It connects your marketing spend directly to a result. |
Getting these metrics right is the foundation of everything else. They are the building blocks you'll use to tell a compelling story about your marketing's impact.
The goal isn't just to calculate a number; it's to build a narrative. Your ROI data tells the story of how marketing directly contributes to the company's bottom line, turning abstract activities into tangible business results.
Ultimately, knowing your marketing ROI is about proving your value. It lets you speak the same language as the rest of the leadership team—the language of revenue, profit, and growth.
When you can clearly show the financial impact of your work, you earn a strategic seat at the table. And that’s how you secure the resources you need to drive even bigger wins down the road.
Alright, let's get down to brass tacks. Before you even touch a calculator, you need to get your data in order.

Seriously, trying to measure marketing ROI with messy data is a recipe for disaster. It's like building a house on a shaky foundation. Sooner or later, it's all going to come crashing down. Solid, clean data is everything.
This isn't just about logging into Google Analytics and calling it a day. You need a system that paints the full picture of the customer journey—from that very first click to the moment they buy. It’s the only way to figure out what’s actually working and what's just noise.
What Data Do You Actually Need?
First up: revenue. You need accurate sales data, pulled straight from your CRM or e-commerce platform. Don't just look at the top-line number. You have to be able to slice and dice it by campaign, by channel, and even by specific groups of customers. To get a better handle on this, you might want to understand how to map these interactions within marketing funnels.
Next, you have to track every single penny you're spending. This is where I see a lot of people go wrong. They'll count their ad spend but forget about everything else. Your real costs include a lot more.
- Direct Campaign Costs: Obvious one. This is your ad spend on Google, Meta, LinkedIn, etc.
- Software and Tools: Think about your CRM, email platform, analytics tools, and all the other tech you're paying for. It adds up.
- Agency and Freelancer Fees: If you're paying an agency or a freelancer, that’s a marketing cost.
- Team Salaries: You should even account for a portion of your marketing team’s salaries, especially if they’re dedicated to specific campaigns.
A huge mistake I see all the time is under-tallying the "cost" side of the ROI equation. If you're not including everything from software fees to a percentage of salaries, you're not getting a real ROI figure. Your boss won't trust a number that feels like it's missing something.
Getting Your Data Sources to Talk to Each Other
Okay, so you know what revenue and cost data you need. Now you have to connect it all. If your data lives in separate, walled-off systems (we call these "silos"), you're flying blind. Your website analytics, CRM, and ad platforms absolutely must be able to share information.
This is all about attribution. When everything is connected, you can draw a straight line from a specific action—like someone clicking on a blog post about increasing organic search traffic that converts—to a sale that shows up in your CRM.
Without that connection, you're just guessing. You have no real proof of what drove that sale. So, before you do anything else, make sure your tracking is solid. Set up your UTM parameters correctly and get your CRM and marketing automation tools synced up. This part is non-negotiable.
Choosing the Right ROI Formula for Your Goal
Not all marketing goals are the same, so why would you measure them with the same yardstick? A one-size-fits-all ROI formula just doesn't cut it in the real world. How you measure a quick-hit paid social campaign is worlds apart from how you'd track a six-month content marketing effort.
The trick is to match your measurement model to what you're actually trying to achieve. Sometimes, the classic formula is perfect. Other times, it's just plain misleading. Before we get into the marketing-specific stuff, it’s worth getting a handle on the basic principles of how to measure ROI in general.
This visual gives you a great high-level look at the process.
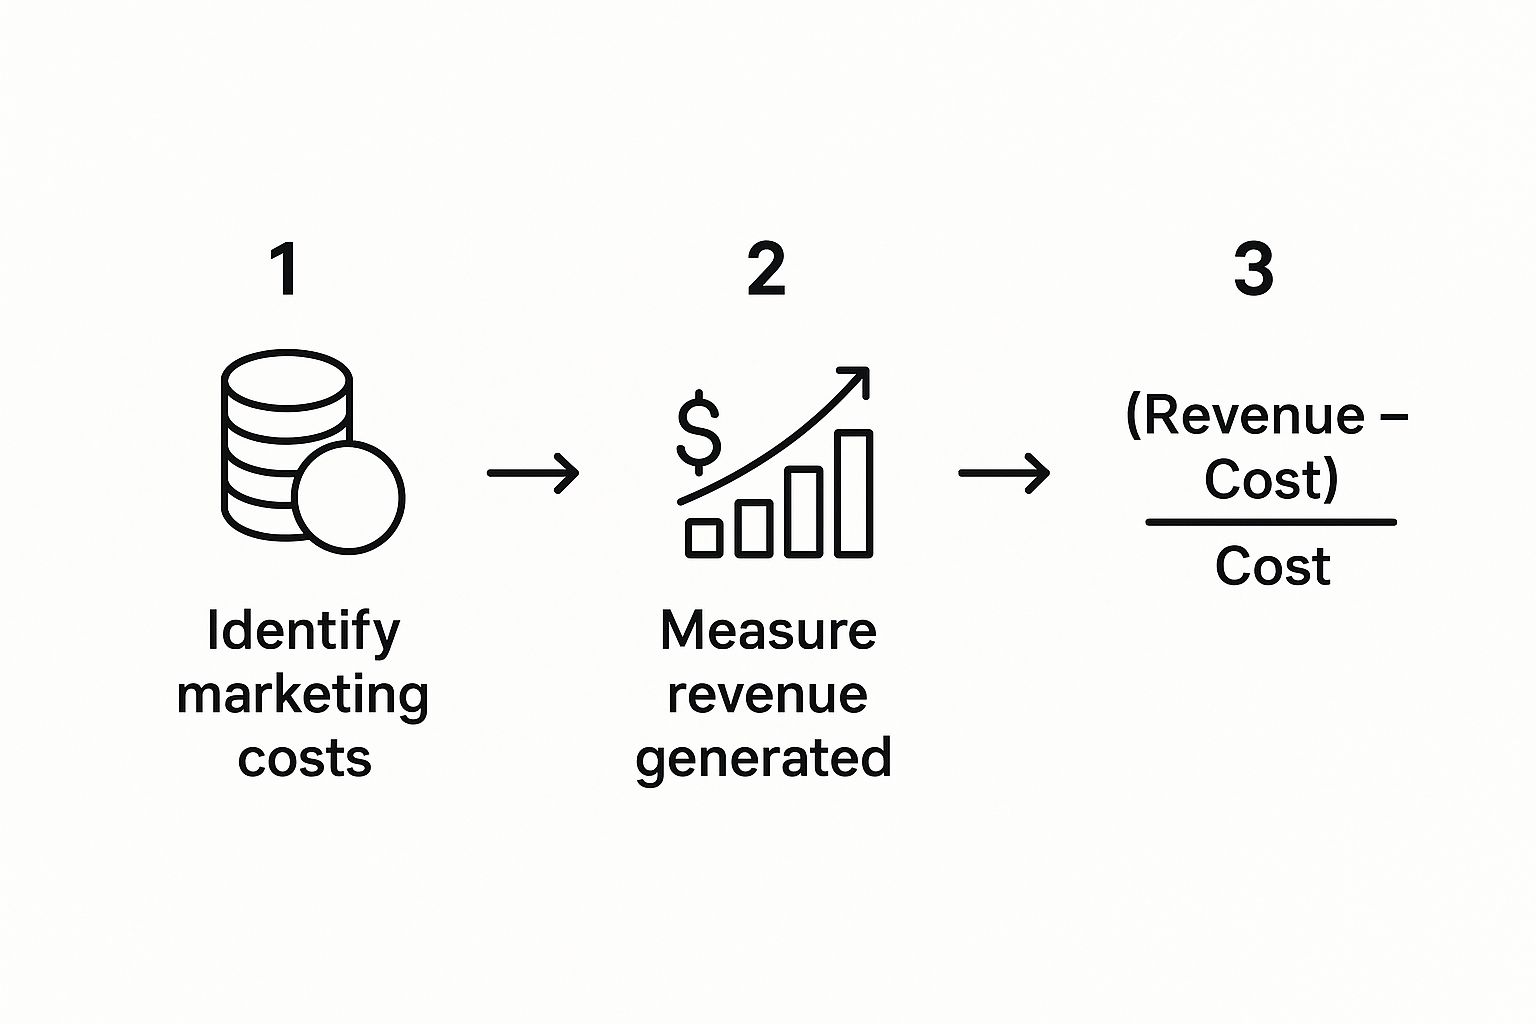
As you can see, it all starts with adding up your costs and then tracking the revenue those costs brought in. From there, you just plug it into the basic formula to find your return.
The Classic ROI Formula: When to Use It
The most straightforward way to calculate marketing ROI is with this simple formula:
(Sales Growth - Marketing Cost) / Marketing Cost
This is your go-to for short-term campaigns where the line between a click and a conversion is short and sweet. Think Google Ads for an e-commerce drop or a special offer you blasted out to your email list. The cause and effect are crystal clear.
Let's say you're running a campaign for a new line of NFT merch.
- You spend $2,000 on social media ads. This is your Marketing Cost.
- The campaign pulls in $10,000 in direct sales. That's your Sales Growth.
- The math looks like this: ($10,000 - $2,000) / $2,000 = 4.
That’s a 400% ROI. For every dollar you put in, you got four dollars back. It's clean, simple, and perfect for proving the immediate value of what you spent.
Moving Beyond Simple ROI with Customer Lifetime Value
But what about marketing that’s playing the long game? The stuff that builds relationships? That’s where the classic formula really falls short. And that's where Customer Lifetime Value (CLV) comes into play.
CLV helps you figure out the total value a customer brings to the table over their entire relationship with you, not just their first purchase. This is absolutely critical for SaaS companies, subscription models, or any project focused on keeping people coming back.
Measuring ROI on a single transaction is like judging a movie by its opening scene. You're missing the whole story. CLV gives you the full picture of what that customer is really worth.
For a lot of us, tracking immediate sales growth is the name of the game, but CLV adds that crucial long-term perspective. It gives you a much truer sense of return for campaigns focused on building loyalty and retaining users—think content, community building, and SEO.
Imagine you run a content marketing strategy for your B2B Web3 service. A new client signs a $1,000/month contract. The initial ROI might look decent, but not mind-blowing. But what if that client sticks around for two years? Their lifetime value is suddenly $24,000.
Now, the ROI on the marketing that brought them in looks incredible. By factoring in CLV, you can easily justify investing in channels that don't always deliver those instant, flashy results but are quietly building a foundation for sustainable, long-term growth.
Solving the Puzzle of Multi-Channel Attribution
Let's be real: customers almost never travel in a straight line. They might see your ad on X, click a search result a week later, read your blog, and then finally convert after you send them an email.
So, who gets the credit? This is the classic multi-channel attribution headache.
If you don't have a smart way to track this, you’ll probably give all the credit to that final email. That’s like praising the striker for a goal but completely ignoring the midfielder who made the perfect assist. You end up with a skewed view of what’s actually moving the needle for your project.
Navigating Common Attribution Models
Most analytics platforms come with a few standard models, and each one tells a slightly different story about that customer journey. The trick is understanding what each model is good for—and where it falls short.
- First-Touch Attribution: This one gives 100% of the credit to the very first time someone interacts with your brand. It’s fantastic for figuring out which channels are your best brand-builders and top-of-funnel fillers.
- Last-Touch Attribution: This is the default for a lot of tools, and honestly, it can be pretty misleading. It gives all the glory to the final touchpoint before a conversion, but it dangerously undervalues all the hard work your other channels did to warm up that lead.
- Linear Attribution: This model takes a "sharing is caring" approach, spreading the credit evenly across every single touchpoint. It’s a more balanced view, acknowledging that every interaction played a part, but it can lack nuance.
Just sticking with the default, especially last-touch, is a recipe for bad decisions. You might end up slashing the budget for a channel that's a discovery goldmine simply because it doesn't directly close sales. It's a surprisingly common trap. While most marketers trust their tech, only about a third actually integrate their traditional and digital metrics, which means they're missing the full picture of how customers bounce between channels.
Choosing an attribution model isn't about finding the one 'perfect' answer—it doesn't exist. It's about picking the model that best aligns with your sales cycle and business goals. This gives you a more honest look at what truly influences your customers.
Choosing the Right Model for Your Business
So, how do you pick the right one? It really comes down to your business. If you have a super short sales cycle—say, you’re selling a low-cost NFT where people decide and buy quickly—a last-touch model might actually be good enough.
But for most of us, especially those with longer, more considered sales funnels, a multi-touch approach is non-negotiable. This is doubly true if you’re running a proper omnichannel marketing strategy where the whole point is to connect with people across different platforms.
If your analytics tools can handle it, look into some of the more advanced models:
- Time-Decay: This model gives more weight to the touchpoints that happen closer to the conversion. It’s a solid choice if you believe the final interactions are the most persuasive.
- U-Shaped (Position-Based): I’m a big fan of this one. It assigns 40% of the credit to the first touch, 40% to the last touch, and splits the remaining 20% among all the interactions in the middle. It values both what got the customer in the door and what sealed the deal.
The ultimate goal here is to get past the guesswork. By playing around with different models, you can develop a much richer, more accurate understanding of how all your marketing channels work together. That's when you can start investing your budget with real confidence and prove the value of everything you’re doing.
How to Present Your Marketing ROI to Get Buy-In
You’ve wrangled the data, crunched the numbers, and have your ROI figures ready to go. But the job’s not done. Honestly, the hardest part is often translating those numbers into a story that gets your leadership team excited and ready to sign off on your next budget.
Just throwing a spreadsheet at them won't cut it. You need to craft a compelling narrative. The goal is to clearly connect the dots between your marketing spend and the company's most important objectives, like user acquisition or revenue growth. Think of it less as a report and more as a story about smart investments and what's coming next.
Your presentation needs to be incredibly clear, visually engaging, and laser-focused on the results. I always recommend leading with a punchy executive summary that gives the bottom line upfront. This lets busy execs get the main point in 30 seconds, but also gives them the option to dive deeper into the channel-by-channel breakdown if they want to.
Frame Your Data as a Narrative
Great ROI reports do more than just list facts and figures; they explain the why behind the numbers. Instead of just saying, “Our X campaign hit a 350% ROI,” you need to give it context and meaning.
For instance, try framing it as a strategic win: “Our targeted X campaign, which we focused entirely on engaging our most active Discord community members, delivered an incredible 350% ROI. This is huge—it shows that doubling down on our core community is the most direct path to acquiring high-value users who stick around.” For more on this kind of targeted messaging, our guide on how to promote a tweet has some great, practical tips.
See the difference? One is a static number. The other is a strategic insight that gives leadership a clear path forward.
Your goal isn't just to report on the past; it's to use past performance to justify future strategy. Frame every piece of data as a stepping stone to the next big win.
When you're putting your slides or report together, lean heavily on simple visuals. A clean bar chart comparing the ROI of different channels will always be more impactful than a dense, confusing table of raw numbers. Make it easy for them to see the wins at a glance.
To give you a real-world example, here’s a simple table format I’ve used to clearly communicate performance to leadership. It’s clean, skimmable, and focuses on the takeaways.
Example Channel ROI Performance Snapshot
| Marketing Channel | Total Investment | Generated Revenue | Calculated ROI (%) | Key Takeaways |
|---|---|---|---|---|
| Paid Social (Twitter/X) | $15,000 | $52,500 | 250% | High-intent audience; cost-effective for direct conversions. |
| Community Events (Discord AMAs) | $5,000 | $25,000 | 400% | Our most efficient channel. Deep engagement drives high LTV users. |
| Content Marketing (Blog) | $12,000 | $18,000 | 50% | Slower burn, but builds long-term authority and organic traffic. |
| Influencer Collabs (Test) | $8,000 | $6,400 | -20% | Audience mismatch; learned that micro-influencers are a better fit. |
This kind of snapshot makes it incredibly easy for anyone to see what's working, what isn't, and why. It invites discussion about strategy, not just about numbers.
Addressing the Tough Questions
Let's be real: not every campaign is going to be a home run. You're going to have some that fall flat, and that's okay. The key is to not try and sweep those under the rug.
Facing a negative ROI head-on shows maturity and builds trust. It proves you're not just a hype person; you're a strategic marketer who tests, learns, and optimizes. Don't think of it as a failure—think of it as a paid lesson.
When you have to report on a dud, structure your explanation this way:
- The Hypothesis: What did you think was going to happen? "We believed this new audience segment would respond well to our offer."
- The Results: What actually happened? "The campaign resulted in a -20% ROI with a very low conversion rate."
- The Learning: What insight did you gain? "We discovered this segment isn't motivated by discounts; they're looking for technical deep-dives."
- The Next Step: How will you apply this learning? "We're pausing spend on this audience and reallocating the budget to community AMAs, which we know work."
Framing it this way turns a loss into a strategic move. You're showing that you spent a small amount to learn something valuable, saving the company from making a much larger, more expensive mistake down the line. It proves you’re a responsible steward of the company’s cash.
Common Questions About Measuring Marketing ROI
Even with a solid framework in place, you’re bound to hit a few roadblocks when you start applying this stuff in the real world. Let's tackle some of the questions I hear most often from Web3 marketers so you can move forward without getting stuck.
How Often Should I Measure My Marketing ROI?
There's no single right answer here. The real answer depends entirely on the channel you're using and your typical sales cycle.
If you're running fast-moving campaigns like PPC or paid social ads, a weekly check-in is essential. It gives you just enough time to react to performance dips or double down on creative that’s hitting the mark.
But for the long game—things like SEO or nurturing a Web3 community—checking your ROI daily or even weekly is a waste of time. It's just noise. For these, a monthly or quarterly review makes way more sense. You have to give your efforts enough breathing room to actually work.
The key is finding a consistent rhythm. You’re looking for meaningful trends and insights to guide your decisions, not just reacting to the random ups and downs of daily data.
What Is Considered a Good Marketing ROI?
Everyone wants that magic number, but I'm telling you, it doesn't exist. While a 5:1 ratio ($5 in return for every $1 spent) is often thrown around as a general benchmark, it’s far from a universal truth. This number can swing wildly based on your industry, profit margins, and what you’re trying to achieve.
Think about it this way:
- An e-commerce store with razor-thin margins might need a 10:1 ROI just to stay profitable.
- A SaaS startup in a land-grab phase might be ecstatic with a 2:1 ratio if their primary goal is just to capture market share fast.
Your best bet is to benchmark against yourself. Look at your own past performance and any industry data you can get your hands on. Your goal should always be to keep improving, not to hit some arbitrary target you read about online.
What If My Campaign Has a Negative ROI?
First off, don't panic. A negative ROI isn't a failure—it’s a data point. In fact, it's a valuable lesson you paid good money to learn.
Instead of sweeping it under the rug, use it as a chance to get smarter. Dig into the data and figure out why it flopped. Was your audience targeting off? Was the creative just weak? Did the landing page completely miss the mark on converting visitors?
Use those insights to either pivot the campaign for another go or strategically cut your losses. There’s no shame in reallocating that budget to a channel you already know is a consistent winner. That's just smart, data-driven marketing.
How Do I Measure ROI for Brand Awareness Campaigns?
Ah, the classic question. Trying to tie direct financial ROI to top-of-funnel stuff like brand awareness is notoriously tricky. The goal isn't to drive direct sales, so you have to shift how you think about measurement.
Instead of looking for immediate revenue, you need to track proxy metrics—things that have a strong connection to future growth. Start measuring the lift in metrics like:
- Branded search volume (are more people Googling you?)
- Direct website traffic
- Social media engagement rates and follower growth
- Your share of voice in the community
Over time, you can start connecting the dots between these leading indicators and lagging revenue growth. This is how you prove the long-term value of building a strong brand, even when you can't draw a straight line from a single tweet to a specific sale.